Important information
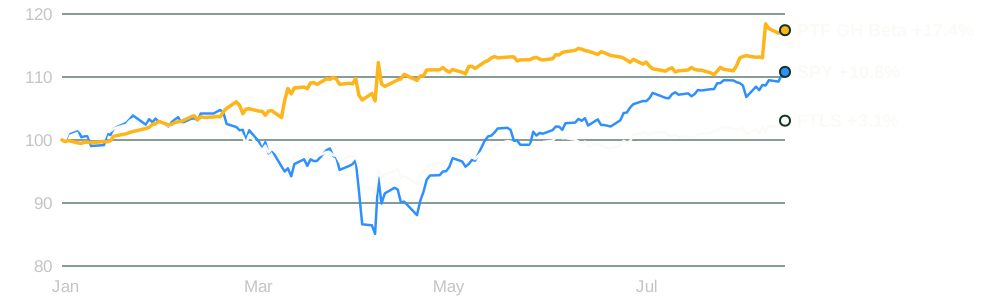
PTF GH Beta Paper Account 2025: results from Interactive Brokers paper-trading account DU3656439 (simulated trading; no capital at risk), portfolio manager Geoff S.T. Hossie, CMT. Returns are net of commissions. SPY and FTLS are total returns. Paper trading began on 15 April 2024. By January 2025 a stricter execution rule was in place: no single leg is held overnight. If one leg of an entry had not filled by the close, the second leg was completed (if the entry spread was still valid) or the first leg was closed; any unfilled exit order was completed before the close. Three of the 432 trades are exceptions: one leg never filled and the trade ran as a single leg for 1 to 16 days. Results before the rule, 15 April to 31 December 2024: +1.5%, largest fall −5.9% (SPY +17.4%, largest fall −8.4%).
¹ Annualised: the result for 1 January to 13 August 2025 (225 days) compounded to a full year. It is an extrapolation of a 7.5-month result, not a return that was earned over twelve months. ² Sortino ratio 3.4 (daily returns, annualised): average daily return above a 4% risk-free rate, divided by downside deviation below that rate. Earlier materials showed 3.82, calculated as annualised return divided by the volatility of down days with no risk-free deduction. The returns and drawdowns are unchanged; only the formula differs. ³ August 2025 is 1 to 13 August.
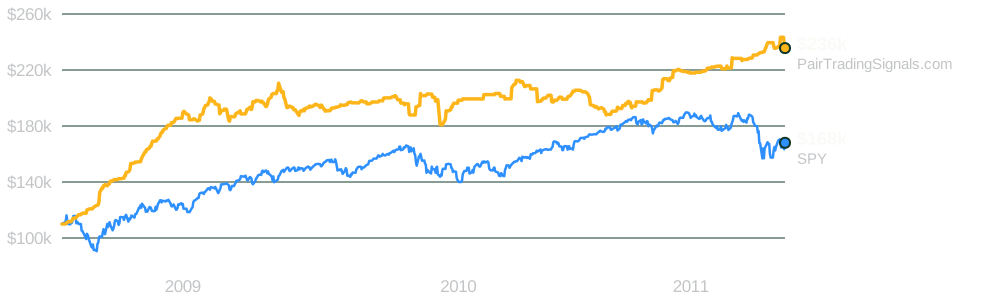
PairTradingSignals.com Account 2009-2011: hypothetical results reconstructed from signals published to subscribers by Trading Software Pty Ltd between January 2009 and September 2011, generated with an early version of the software; today’s version differs. $110,000 account, $10,000 a leg, exposure capped at 6x. Not a brokerage record and not audited. Closed trades only: 75 signals with no published exit are left out. Costs, borrow and financing are estimates. ⁴ Measured on monthly returns from closed trades, so falls within trades would be deeper and the ratios are not directly comparable with the daily 2025 figures.
⁵ Correlation with SPY: 1.00 means moving in step with the S&P 500 and 0 means no relationship. The 2025 figure uses daily returns. The 2009-2011 figure uses monthly returns from closed trades, which understates day-to-day co-movement, so the two figures are not directly comparable.
Hypothetical or simulated performance results have certain limitations. Unlike an actual performance record, simulated results do not represent actual trading. Also, since the trades have not actually been executed, the results may have under- or over-compensated for the impact, if any, of certain market factors, such as lack of liquidity. Simulated trading programs in general are also subject to the fact that they are designed with the benefit of hindsight. No representation is being made that any account will or is likely to achieve profits or losses similar to those shown.
Past performance does not guarantee future results. This page is for information only and is not investment advice.